


RIGHT-SWIPE Study Results: Screen Time Impact
"Right-sizing Screen Wellness and Information Processing Efficiency [RIGHT-SWIPE]" Results released today in this post!

Hello readers, so thankful you’re here today.
Today’s post is exclusive results from Toward Wellth’s semi-scientific study of engineering the iPhone Scheduled Summary feature to decrease screen time and pickups.
Because the mood strikes me, today’s post is written as if it were an informative research abstract. That means it will follow the scientific article flow of Background, Method, Results, Conclusion. [“Good” scientific abstracts also have catchy titles or the studies themselves have interesting acronyms, which is why I am calling it the SWIPE study. Clever, eh?]
Right-sizing Screen Wellness and Information Processing for Efficiency [RIGHT-SWIPE]: An “n of one” study to testing the impact of a notification reduction technique on screen time and pickups.
Rodgers EE.
Background
Last month you may have read the post exploring how frequently we pick our your phones - and today’s post increases your awareness of strategies to decrease digital dependence (“screen time”). Here’s a link to that post as a potential primer if you didn’t read it on initial distribution:

The key things to know is most people abuse their digital devices. The average screen time, per day, of Americans is a bit over 7 hours per day. When you add in all media into what is consumed (not just ‘screen time’), the average is around 8.5 hours per day.
This study involves myself (“n of one” as they say when there’s only one research subject), as this year I started the year at approximately 5.75-6 hours per day as a weekly average of screen time.
I set a goal to decrease it by 10% by the end of the year. A goal I figured was achievable (and would go onto my list again year after year until I felt I had a truly ‘healthy’ use of digital resources).
Doing cursory research and implementing a few small ‘life hacks’ between the beginning of the year and April resulted in me consistently being at about 4.75-5 hours per day as a weekly average - simply by leveraging a few techniques in this post:

What followed was a larger proportion of screen time going to ‘mindful’ activities instead of ‘mindless’ doom-scrolling. See May’s post on that topic here:

Even after learning more and implementing incremental steps to be even more present, I still found that there was a draw that kept me plateaued at 5 hours per day on average of screen time. Well below my target for the year of 10% (it’s between 16-20% from baseline at beginning of year) although I have also become hyper-aware of when I reach for my phone or thinking what I was going to use my phone for before I picked it up… so I sought more sustainable ways to impact decreases to phone pickups and total screentime.
Method
Other life hacks for work include the concept of checking your email at intervals throughout the day and turning off desktop notifications. (aka decreasing ‘workplace interruptions’)
Borrowing from that approach, this experiment uses the Scheduled Summary feature in the iPhone (for Scheduled Notifications) to test decreasing notifications. For those not aware, it’s a feature that is marketed/intended to decrease some of your less important notifications from being immediate-push to being delivered to you a few times a day. See details on Apple’s page here.
For this study, a mass reconfiguration of notifications occurred, with all non-essential notifications* (see footnote) set to go to scheduled summaries on intervals set by the subject. The subject chose 10 scheduled summary points throughout the day. The intervals between Scheduled Summaries ranged from 45-140 minutes depending on the time of day. The intervals start at 7:00am (after normal wakeup) and end at 9:45pm (around end of day).
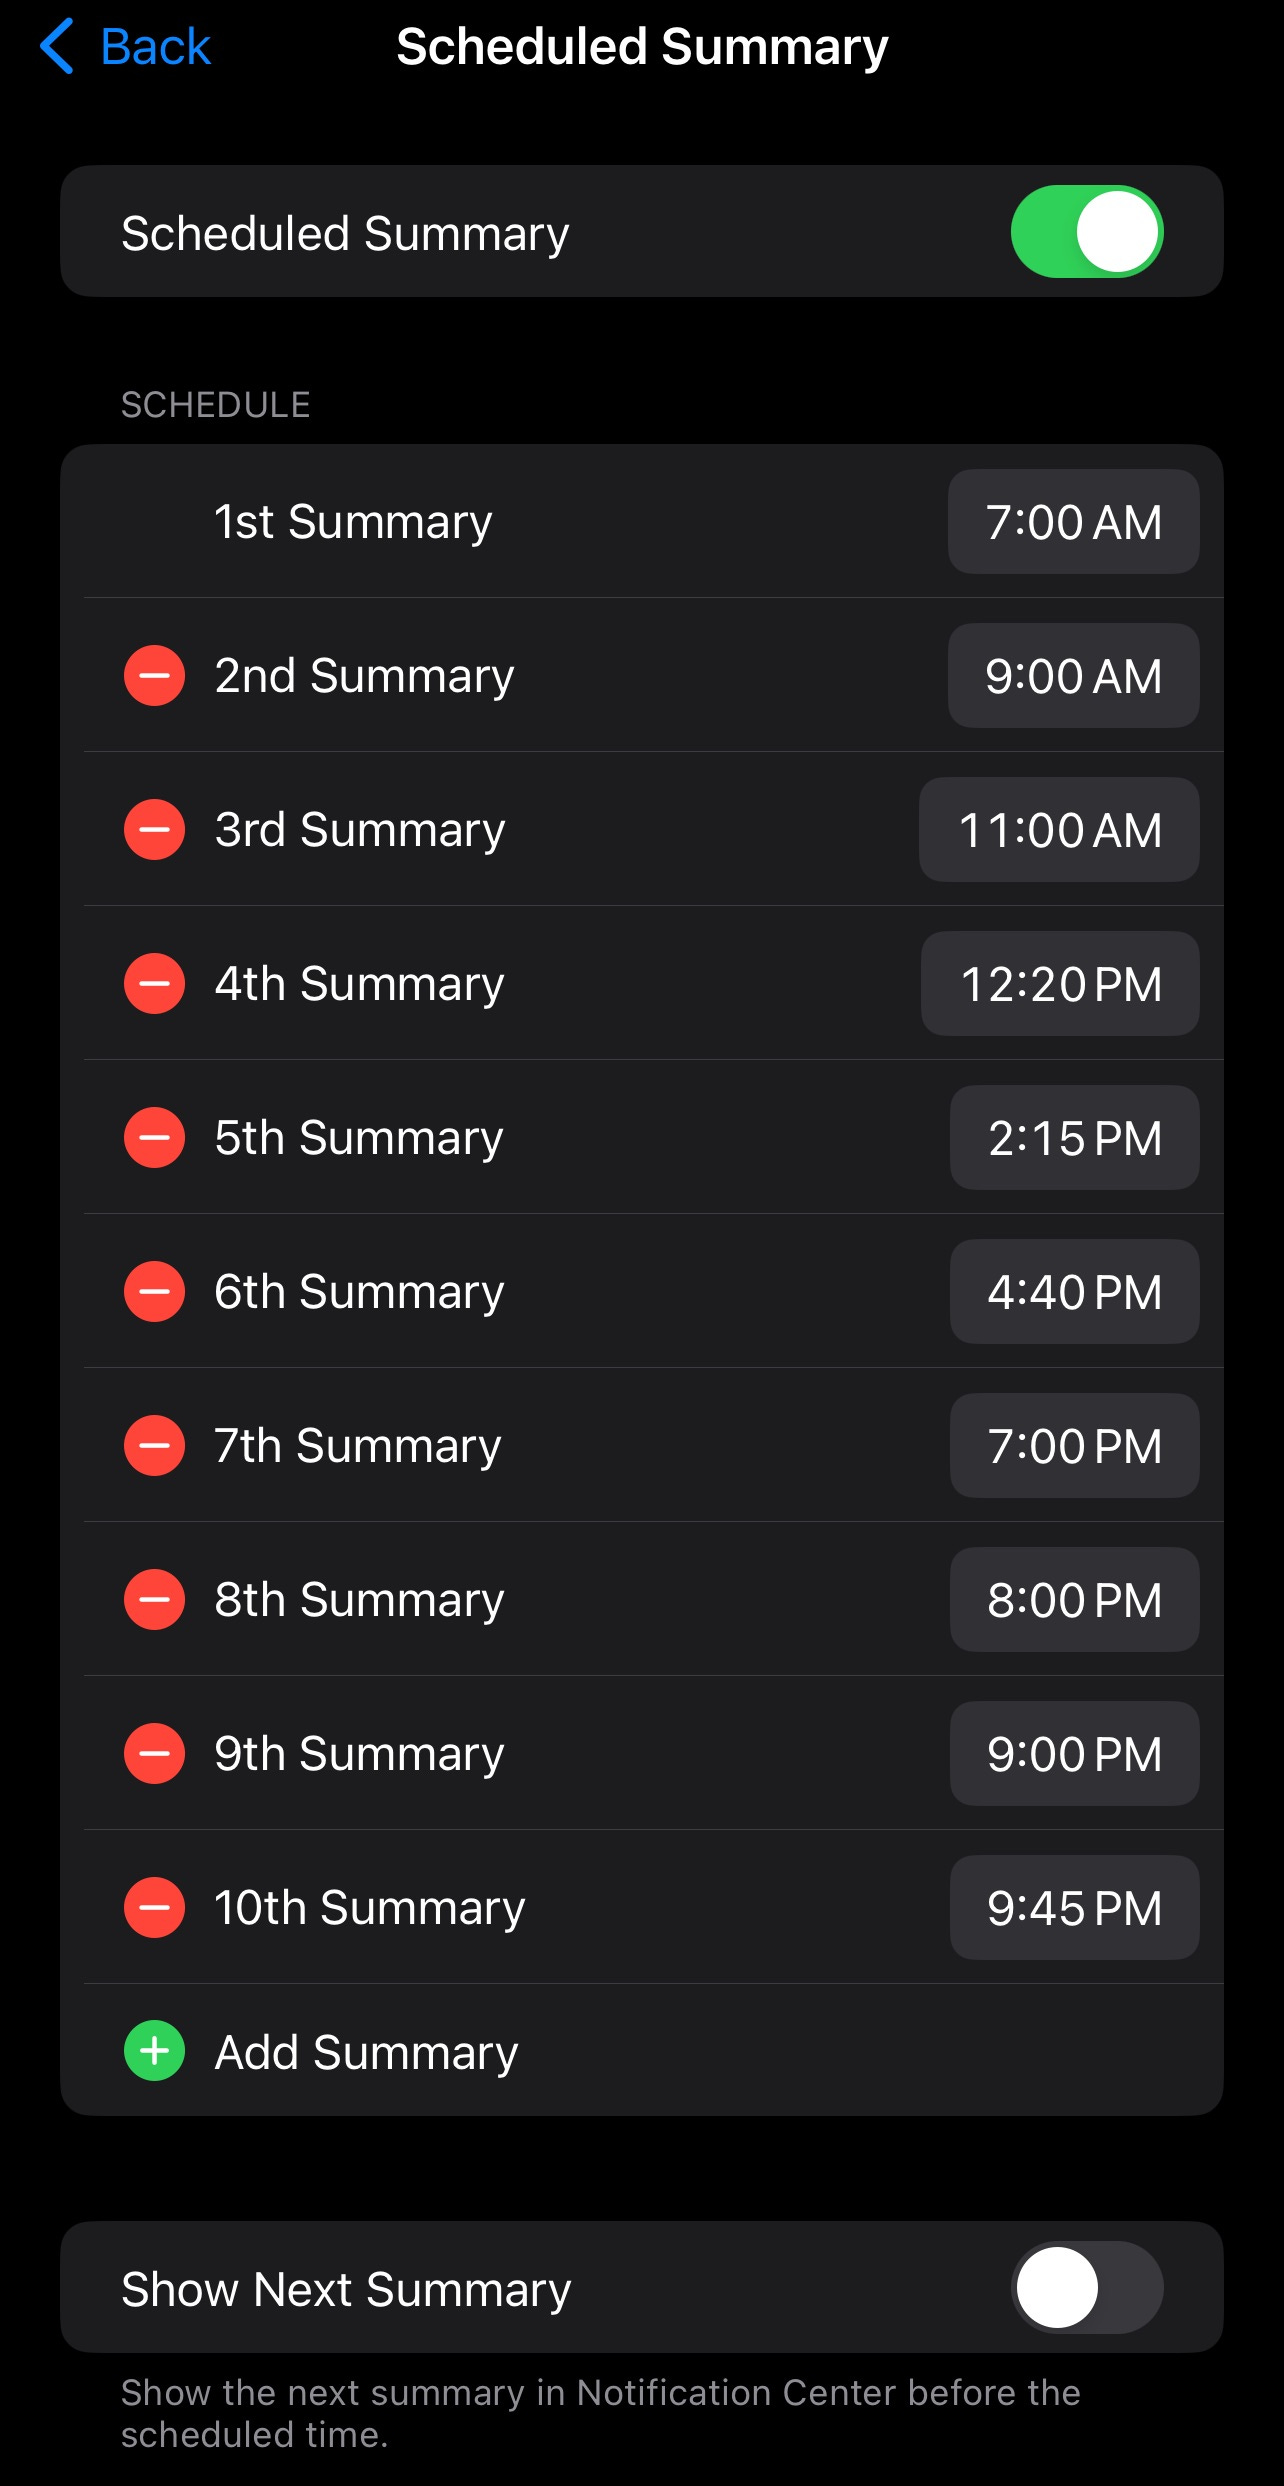
Also, the option to “Show Next Summary” which is defaulted to On, was turned off, testing the hypothesis that ‘the notification summary can wait’.
The primary endpoint is measuring impact on screentime. The secondary endpoint is measuring impact on # of pickups (distractions).
The endpoints will be tested by measuring average screentime per day per week and average # of daily pickups at baseline per day per week (pre-intervention) and after the intervention has been used for 2 weeks (experimental weeks). Pre intervention periods are the weeks starting June 30 and July 8, respectively. Experimental weeks are the weeks starting July 15 and July 22. To make the cutoff for this post, Saturday July 27 is excluded from the analysis.
Results
At start of the experimental phase, the week of July 15, the subject reflected on when they would use their phone and observed no apparent patterns. Configurations were made to the Scheduled Summary and for two weeks, the subject participated without exception.
The results in the pre-implementation period and experimental period were pulled on 7/26 at 9pm with the following results.

In the pre-intervention period, the subject was between 4.9 and 5.1 hours per day of screentime, and with the scheduled summary tactic implemented, that decreased to between 3.9 and 4.0 hours per day. (a 20% decrease from study baseline, almost a 40% decrease from the beginning of the year.)

Similar results were found with Pickups, with a decrease from between 142 and 145 pickups in the pre-intervention period to 124 and 113 pickups in the experimental period. (a 14-22% decrease)
Further, the subject noted qualitatively they had “less feelings of interruption” and further provided the reflection that previously a random notification from the social media apps in the middle of the day would cascade into a multiple application check - ensuring all the ‘red notifications’ are tended to. When there wasn’t a random notification to take attention from another daily task, that cascade didn’t occur.
Conclusions
The study met its primary and secondary endpoints, demonstrating that Scheduled Summary, when deployed methodically and beyond the default use case can have a significant impact on screen time and pickups. Qualitatively it decreased the subjects anxiety as they had less feelings of interruption.
The self-reported phenomenon of not having a cascade of application checking caused by one mid-day notification could explain the mechanism by which the decrease in pickups led to a significant decrease in screen time. Further study is indicated if pickups and screen time can further be decreased.
* Non-essential apps included all social media apps, although it’s easier to say that the essential apps were: Messages (text), Teams Messages (work messaging redundancy), Home doorbell, Phone, and Calendar (appointment reminders).
This approach removed hundreds of notifications from amazon, Facebook Messenger, Substack, Facebook, Instagram, LinkedIn, and similar apps.
If you’re reading this article on Saturday night and appreciate what being social does for your happiness and Wellth, forward this post to a friend that you want to spend time with... send them this article as a way to show that you want to deepen your relationship.
If you reading this after Saturday night and if the topic resonates with you, forward it to a friend who might also benefit. If you just want to share this Toward Wellth Substack, click here and it will let you share on a variety of platforms.